

A service of Scott P. Rogers, Associate Broker, Funkhouser Real Estate Group 540.578.0102 | scott@HarrisonburgHousingToday.com
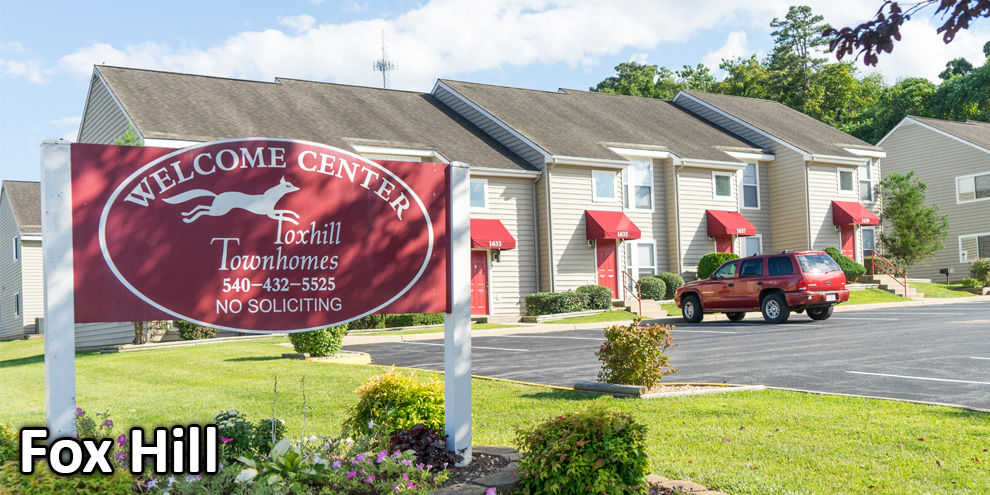
FOX HILL
Hunters Ridge • Camden Townes • Fox Hill • Madison Manor • Pheasant Run • Campus View Condos
Sales Per Year....
| 2025 | 0 (ytd) | |
| 2024 |

|
2 |
| 2023 | 0 | |
| 2022 |
|
1 |
| 2021 |
|
2 |
| 2020 | 0 | |
| 2019 | 0 | |
| 2018 | 0 | |
| 2017 |
|
1 |
| 2016 | 0 | |
| 2015 |
|
1 |
| 2014 |
|
1 |
| 2013 |
|
2 |
| 2012 |
|
5 |
| 2011 |
|
2 |
| 2010 |
|
7 |
| 2009 |
|
1 |
| 2008 | 0 | |
| 2007 | 0 | |
| 2006 | 0 | |
| 2005 |
|
1 |
Median Sales Price....
| 2025 | $0 | |
| 2024 |

|
$249,750 |
| 2023 | $0 | |
| 2022 |
|
$230,000 |
| 2021 |
|
$195,000 |
| 2020 | $0 | |
| 2019 | $0 | |
| 2018 | $0 | |
| 2017 |
|
$156,000 |
| 2016 | $0 | |
| 2015 |
|
$145,000 |
| 2014 |
|
$135,000 |
| 2013 |
|
$129,000 |
| 2012 |
|
$145,000 |
| 2011 |
|
$155,660 |
| 2010 |
|
$158,000 |
| 2009 |
|
$169,950 |
| 2008 | $0 | |
| 2007 | $0 | |
| 2006 | $0 | |
| 2005 |
|
$149,900 |
Sample Fox Hill Investment Analysis....
| Property Details | ||
| Purchase Price | $0 | based on median sales price |
| Income (Annual) | ||
| Monthly Rental Rate | $1,800 | estimate based on currently available rental data |
| Projected Vacancy | 4% | half a month per year |
| Gross Operating Income | $20,736 | |
| Expense (Annual) | ||
| Real Estate Taxes | $0 | estimate based on median sales price |
| Repairs | $1,800 | estimate based on typical property condition |
| Association Dues | $1,320 | estimated to be $110 per month |
| Property Management | $0 | assuming self management |
| Insurance | $0 | estimate based on recent trends |
| Utilities | $0 | assumes tenant pays all utilities |
| Advertising | $100 | estimate |
| Total Operating Expenses | $3,220 | |
| Cash Flow Before Tax | ||
| Gross Operating Income | $20,736 | |
| - Operating Expenses | - $3,220 | |
| Net Operating Income | $17,516 | |
| - Annual Debt Service | - $0 | financing 80% of the purchase price at 7.75% |
| Cash Flow Before Taxes | $17,516 | |
Sales in the Past 36 Months....
| Jul 3, 2024 | 1460 Devon Ln, Harrisonburg, VA 22801 | 4 BR | 2 BA | 1,504 SF | $259,000 |
| Jan 19, 2024 | 1472 Devon Ln, Harrisonburg, VA 22801 | 4 BR | 2 BA | 1,504 SF | $240,500 |
| Oct 31, 2022 | 1552 Devon Ln, Harrisonburg, VA 22801 | 4 BR | 2 BA | 1,504 SF | $230,000 |
Current Listings....
There are no properties on the market right now!
Neighborhood Map....